
I wanted to install Prometheus and Grafana on my new Kubernetes cluster, but in order for these packages to work they need someplace to store persistent data. I had run performance and scale tests on Ceph when I was working as a Cloud Architect at Seagate, and I’ve played with Rook during the past year, so I decided to install Rook+Ceph and use that for the Kubernetes cluster’s data storage.
Ceph is a distributed storage system that provides object, file, and block storage. On each storage node you’ll find a file system where Ceph stores objects and a Ceph OSD (Object storage daemon) process. On a Ceph cluster you’ll also find Ceph MON (monitoring) daemons, which ensure that the Ceph cluster remains highly available.
Rook acts as a Kubernetes orchestration layer for Ceph, deploying the OSD and MON processes as POD replica sets. From the Rook README file:
Rook turns storage software into self-managing, self-scaling, and self-healing storage services. It does this by automating deployment, bootstrapping, configuration, provisioning, scaling, upgrading, migration, disaster recovery, monitoring, and resource management. Rook uses the facilities provided by the underlying cloud-native container management, scheduling and orchestration platform to perform its duties.
https://github.com/rook/rook/blob/master/README.md
When I created the cluster I built VMs with 40GB hard drives, so with 5 Kubernetes nodes that gives me ~200GB of storage on my cluster, most of which I’ll use for Ceph.
Installing Rook+Ceph
Installing Rook+Ceph is pretty straightforward. On my personal cluster I installed Rook+Ceph v0.9.0 by following these steps:
git clone git@github.com:rook/rook.git
cd rook
git checkout v0.9.0
cd cluster/examples/kubernetes/ceph
kubectl create -f operator.yaml
kubectl create -f cluster.yaml
Rook deploys the PODs in two namespaces, rook-ceph-system and rook-ceph. On my cluster it took about 2 minutes for the PODs to deploy, initialize, and get to a running state. While I was waiting for everything to finish I checked the POD status with:
$ kubectl -n rook-ceph-system get pod
NAME                                  READY   STATUS    RESTARTS   AGE
rook-ceph-agent-8tsq7                 1/1     Running   0          2d20h
rook-ceph-agent-b6mgs                 1/1     Running   0          2d20h
rook-ceph-agent-nff8n                 1/1     Running   0          2d20h
rook-ceph-agent-vl4zf                 1/1     Running   0          2d20h
rook-ceph-agent-vtpbj                 1/1     Running   0          2d20h
rook-ceph-agent-xq5dv                 1/1     Running   0          2d20h
rook-ceph-operator-85d64cfb99-hrnbs   1/1     Running   0          2d20h
rook-discover-9nqrp                   1/1     Running   0          2d20h
rook-discover-b62ds                   1/1     Running   0          2d20h
rook-discover-k77gw                   1/1     Running   0          2d20h
rook-discover-kqknr                   1/1     Running   0          2d20h
rook-discover-v2hhb                   1/1     Running   0          2d20h
rook-discover-wbkkq                   1/1     Running   0          2d20h
$ kubectl -n rook-ceph get pod
NAME READY STATUS RESTARTS AGE
rook-ceph-mgr-a-7d884ddc8b-kfxt9 1/1 Running 0 2d20h
rook-ceph-mon-a-77cbd865b8-ncg67 1/1 Running 0 2d20h
rook-ceph-mon-b-7cd4b9774f-js8n9 1/1 Running 0 2d20h
rook-ceph-mon-c-86778859c7-x2qg9 1/1 Running 0 2d20h
rook-ceph-osd-0-67fff79666-fcrss 1/1 Running 0 35h
rook-ceph-osd-1-58bd4ccbbf-lsxj9 1/1 Running 1 2d20h
rook-ceph-osd-2-bf99864b5-n4q7v 1/1 Running 0 2d20h
rook-ceph-osd-3-577466c968-j8gjr 1/1 Running 0 2d20h
rook-ceph-osd-4-6856c5c6c9-92tb6 1/1 Running 0 2d20h
rook-ceph-osd-5-8669577f6b-zqrq9 1/1 Running 0 2d20h
rook-ceph-osd-prepare-node1-xfbs7 0/2 Completed 0 2d20h
rook-ceph-osd-prepare-node2-c9f55 0/2 Completed 0 2d20h
rook-ceph-osd-prepare-node3-5g4nc 0/2 Completed 0 2d20h
rook-ceph-osd-prepare-node4-wj475 0/2 Completed 0 2d20h
rook-ceph-osd-prepare-node5-tf5bt 0/2 Completed 0 2d20hFinal tasks
Now I need to do two more things before I can install Prometheus and Grafana:
- I need to make Rook the default storage provider for my cluster.
- Since the Prometheus Helm chart requests volumes formatted with the XFS filesystem, I need to install XFS tools on all of my Ubuntu Kubernetes nodes. (XFS is not yet installed by Kubespray by default, although there’s currently a PR up that addresses that issue.)
Make Rook the default storage provider
To make Rook the default storage provider I just run a kubectl command:
kubectl patch storageclass rook-ceph-block -p '{"metadata": {"annotations":{"storageclass.kubernetes.io/is-default-class":"true"}}}'That updates the rook-ceph-block storage class and makes it the default for storage on the cluster. Any applications that I install will use Rook+Ceph for their data storage if they don’t specify a specific storage class.
Install XFS tools
Normally I would not recommend running one-off commands on a cluster. If you want to make a change to a cluster, you should encode the change in a playbook so it’s applied every time you update the cluster or add a new node. That’s why I submitted a PR to Kubespray to address this problem.
However, since my Kubespray PR has not yet merged, and I built the cluster using Kubespray, and Kubespray uses Ansible, one of the easiest ways to install XFS tools on all hosts is by using the Ansible “run a single command on all hosts” feature:
cd kubespray
export ANSIBLE_REMOTE_USER=ansible
ansible kube-node -i inventory/mycluster/hosts.ini \
  --become --become-user root \
  -a 'apt-get install -y xfsprogs'
Deploy Prometheus and Grafana
Now that XFS is installed I can successfully deploy Prometheus and Grafana using Helm:
helm install --name prometheus stable/prometheus
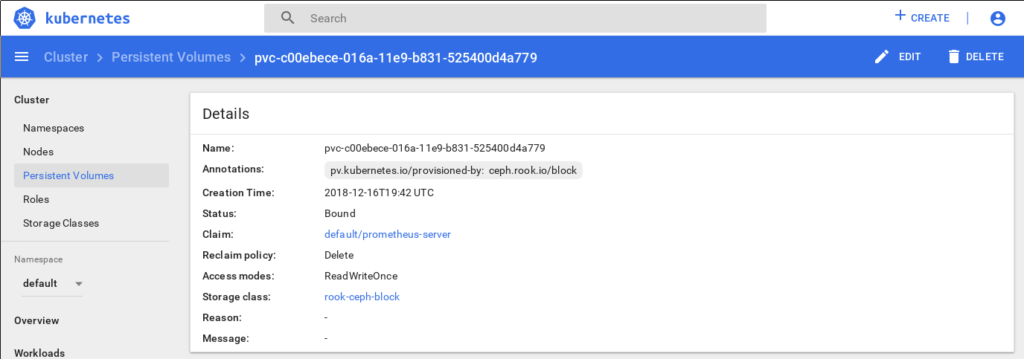
helm install --name grafana stable/grafanaThe Helm charts install Prometheus and Grafana and create persistent storage volumes on Rook+Ceph for Prometheus Server and Prometheus Alert Manager (formatted with XFS).
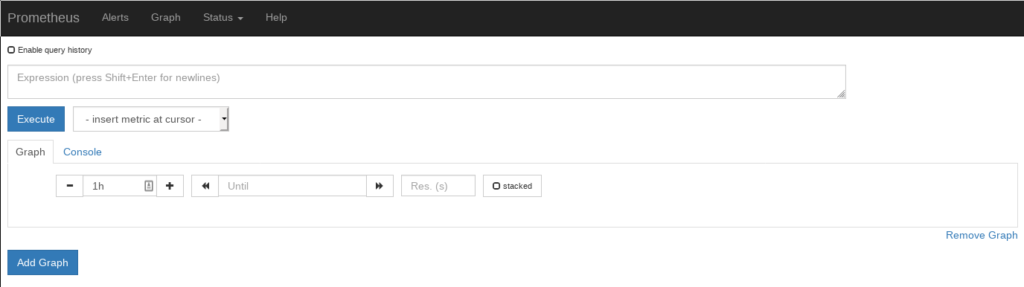
Prometheus dashboard
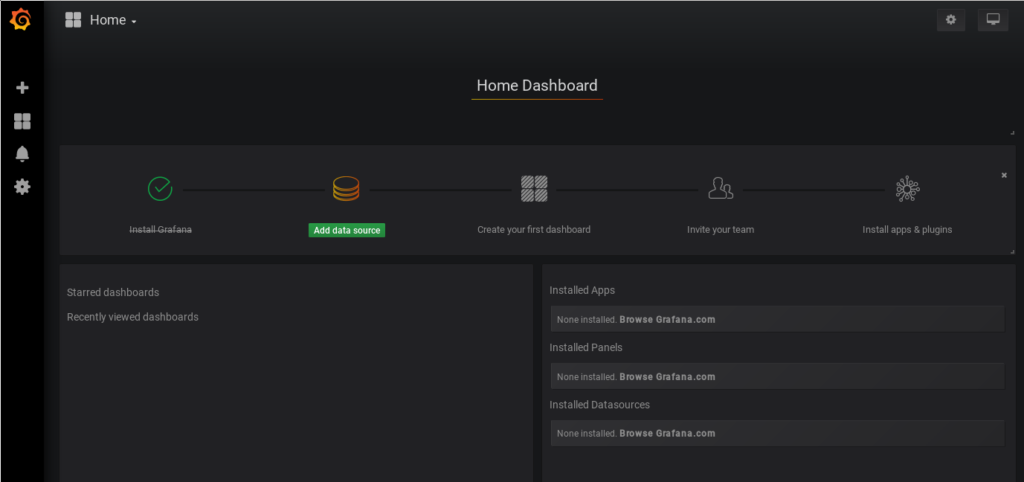
Grafana dashboard
Rook persistent volume for Prometheus Server
Want to learn more?
If you’re interested in learning more about Rook, watch these videos from KubeCon 2018:
Introduction to Rook
Rook Deep Dive
Hope you find this useful.