post

Getting NVIDIA NGC containers to work with VMware PVRDMA networks

NVIDIA publishes a set of NVIDIA GPU-accelerated Containers (NGC) with applications and frameworks for machine learning, deep learning, and high-performance computing.

VMware developed a platform that allows people and companies to create their own private clouds. For customers with high-speed, low-latency networking requirements they offer a couple of different networking options, one of which is PVRDMA (ParaVirtualized Remote Direct Memory Access) networking.

Full disclosure: I used to work for a startup called Bitfusion, and that startup was bought by VMware, so I now work for VMware. At Bitfusion we developed a technology for accessing hardware accelerators, such as NVIDIA GPUs, remotely across networks using TCP/IP, Infiniband, and PVRDMA. I still work on the Bitfusion product at VMware, and spend a lot of my time getting AI and ML workloads to work across networks on virtualized GPUs.

OpenFabrics Enterprise Distribution (OFED) is open-source software for RDMA applications which includes a set of drivers for high-speed network cards to enable RDMA/Infiniband networking. Some NVIDIA NGC containers ship with Mellanox OFED (MOFED) installed. NVIDIA bought Mellanox in 2020, and MOFED is NVIDIA’s distribution of OFED with all of the non-Mellanox drivers removed. OFED includes support for PVRDMA, but MOFED does not.

NVIDIA containers are based on Ubuntu base images. Ubuntu ships its own RDMA drivers in a package called rdma-core. The Ubuntu rdma-core package contains the open source drivers and utilities needed to work with VMware PVRDMA networking.

The Ubuntu rdma-core package contains the open source drivers and utilities needed to work with VMware PVRDMA networking.

Ideally you should only install the RDMA network package that you need, either MOFED or OFED or rdma-core, but not more than one of them. In fact, if you try installing more than one you will have problems. Therefore, if you’re going to use NGC containers on a PVRDMA network you should first remove the MOFED packages and then add the rdma-core packages.

Luckily you can start an NGC container and see if MOFED is installed or not and see what version is installed. If I start the NGC container for Tensor RT:

docker run -it --rm -u root nvcr.io/nvidia/tensorrt:19.09-py3

I can see that it’s based on Ubuntu 18.04 “bionic”:

root@2e70d41e1187:/workspace# cat /etc/os-release
NAME="Ubuntu"
VERSION="18.04.3 LTS (Bionic Beaver)"
ID=ubuntu
ID_LIKE=debian
PRETTY_NAME="Ubuntu 18.04.3 LTS"
VERSION_ID="18.04"
HOME_URL="https://www.ubuntu.com/"
SUPPORT_URL="https://help.ubuntu.com/"
BUG_REPORT_URL="https://bugs.launchpad.net/ubuntu/"
PRIVACY_POLICY_URL="https://www.ubuntu.com/legal/terms-and-policies/privacy-policy"
VERSION_CODENAME=bionic
UBUNTU_CODENAME=bionic

If I look inside /opt/mellanox/DEBS/ I can see if any MOFED .deb files are installed:

root@2e70d41e1187:/workspace# ls -al /opt/mellanox/DEBS/
total 64
drwxrwxr-x 15 root root 4096 Aug 27  2019 .
drwxr-xr-x  3 root root 4096 Sep 13  2019 ..
drwxrwxr-x  2 root root 4096 Aug 27  2019 3.4-1.0.0
drwxrwxr-x  2 root root 4096 Aug 27  2019 3.4-2.0.0
drwxrwxr-x  2 root root 4096 Aug 27  2019 4.0-1.0.1
drwxrwxr-x  2 root root 4096 Aug 27  2019 4.0-2.0.0
lrwxrwxrwx  1 root root    9 Aug 27  2019 4.0-2.0.2 -> 4.0-2.0.0
drwxrwxr-x  2 root root 4096 Aug 27  2019 4.1-1.0.2
drwxrwxr-x  2 root root 4096 Aug 27  2019 4.2-1.0.0
drwxrwxr-x  2 root root 4096 Aug 27  2019 4.2-1.2.0
drwxrwxr-x  2 root root 4096 Aug 27  2019 4.3-1.0.1
lrwxrwxrwx  1 root root    9 Aug 27  2019 4.3-3.0.2 -> 4.3-1.0.1
drwxrwxr-x  2 root root 4096 Aug 27  2019 4.4-1.0.0
drwxrwxr-x  2 root root 4096 Aug 27  2019 4.4-2.0.7
drwxrwxr-x  2 root root 4096 Aug 27  2019 4.5-1.0.1
drwxrwxr-x  2 root root 4096 Aug 27  2019 4.6-1.0.1
lrwxrwxrwx  1 root root    9 Aug 27  2019 5.0-0 -> 5.0-1.1.8
drwxrwxr-x  2 root root 4096 Aug 27  2019 5.0-1.1.8
-rwxrwxr-x  1 root root  546 Aug 27  2019 add_mofed_version.sh

In this case there are Mellanox MOFED packages installed. If I look inside these directories (ls -1 /opt/mellanox/DEBS/*) I can see that the packages installed from MOFED are:

  • ibverbs-utils
  • libibverbs-dev
  • libibverbs1
  • libmlx5-1

These are MOFED versions of packages installed in this specific container. A different NGC container might contain these MOFED packages, or different MOFED packages, or no MOFED packages at all.

There are versions of these same packages in Ubuntu repos, and the Ubuntu versions conflict with the MOFED versions. To use the Ubuntu versions, first remove the MOFED packages:

root@2e70d41e1187:/workspace# apt-get purge -y ibverbs-utils libibverbs-dev libibverbs1 libmlx5-1
Reading package lists... Done
Building dependency tree
Reading state information... Done
The following packages will be REMOVED:
  ibverbs-utils* libibverbs-dev* libibverbs1* libmlx5-1*
0 upgraded, 0 newly installed, 4 to remove and 23 not upgraded.
After this operation, 1523 kB disk space will be freed.
(Reading database ... 18622 files and directories currently installed.)
Removing ibverbs-utils (41mlnx1-OFED.4.4.1.0.0.44100) ...
Removing libibverbs-dev (41mlnx1-OFED.4.4.1.0.0.44100) ...
Removing libmlx5-1 (41mlnx1-OFED.4.4.0.1.7.44100) ...
Removing libibverbs1 (41mlnx1-OFED.4.4.1.0.0.44100) ...
Processing triggers for libc-bin (2.27-3ubuntu1) ...
(Reading database ... 18449 files and directories currently installed.)
Purging configuration files for libmlx5-1 (41mlnx1-OFED.4.4.0.1.7.44100) ...

You can see in the output above that the packages that I removed have the name “OFED” in them, indicating that they came from MOFED/OFED, not Ubuntu. If I reinstall using rdma-core and the other packages I need:

apt-get update && apt-get install -y --reinstall \
    -t bionic rdma-core libibverbs1 ibverbs-providers \
    infiniband-diags ibverbs-utils libcapstone3

This installs everything from the Ubuntu repositories for the “bionic” version, which is the version of Ubuntu that this NGC container is based on. (Which we determined back in step 1.)

The -t flag is necessary because I’ve found that some NGC containers mix code from the repositories of different versions of Ubuntu, and we only want to install packages from the base Ubuntu version, which is “bionic” in this particular case.

At this point the container is ready to use PVRDMA connections.

However, I also want to connect to a remote Bitfusion server across a PVRDMA network and use a pool of GPUs for my TensorRT work, so I also install the Bitfusion client:

wget https://packages.vmware.com/bitfusion/ubuntu/18.04/bitfusion-client-ubuntu1804_3.0.0-11_amd64.deb

apt-get install -y ./bitfusion-client-ubuntu1804_3.0.0-11_amd64.deb

To create a new container with all of these changes I just have to whip up a small Dockerfile:

# Base this container on the NGC container you want to use
FROM nvcr.io/nvidia/tensorrt:19.09-py3

# Remove the MOFED packages that are installed,
# determined by running “ls -1 /opt/mellanox/DEBS/*”
RUN apt-get purge -y ibverbs-utils libibverbs-dev \
    libibverbs1 libmlx5-1

# Install the Ubuntu RDMA packages using the
# UBUNTU_CODENAME from /etc/os-release
# as the -t argument.
RUN apt-get update && apt-get install -y --reinstall \
    -t bionic \
    rdma-core libibverbs1 ibverbs-providers \
    infiniband-diags ibverbs-utils libcapstone3

# Install the Bitfusion 3.0.0 client software for Ubuntu 18.04
RUN wget https://packages.vmware.com/bitfusion/ubuntu/18.04/bitfusion-client-ubuntu1804_3.0.0-11_amd64.deb

RUN apt-get install -y ./bitfusion-client-ubuntu1804_3.0.0-11_amd64.deb

To build an image using this Dockerfile:

mkdir -p ~/build
docker build -t tensorrt:19.09-py3-pvrdma -f Dockerfile ~/build

Run this image:

docker run -it --rm -u root --network host \
    tensorrt:19.09-py3-pvrdma

In this instance I’m passing the host’s network through to the container. Assuming that the host already has PVRDMA networking set up correctly, I can use that PVRDMA network inside the NGC container. With the Bitfusion client in the container I can run TensorRT and access GPUs from a remote pool of GPUs across a PVRDMA network.

Hope you find this useful.

post

Using Rook+Ceph for persistent storage on Kubernetes

I wanted to install Prometheus and Grafana on my new Kubernetes cluster, but in order for these packages to work they need someplace to store persistent data. I had run performance and scale tests on Ceph when I was working as a Cloud Architect at Seagate, and I’ve played with Rook during the past year, so I decided to install Rook+Ceph and use that for the Kubernetes cluster’s data storage.

Ceph is a distributed storage system that provides object, file, and block storage. On each storage node you’ll find a file system where Ceph stores objects and a Ceph OSD (Object storage daemon) process. On a Ceph cluster you’ll also find Ceph MON (monitoring) daemons, which ensure that the Ceph cluster remains highly available.

Rook acts as a Kubernetes orchestration layer for Ceph, deploying the OSD and MON processes as POD replica sets. From the Rook README file:

Rook turns storage software into self-managing, self-scaling, and self-healing storage services. It does this by automating deployment, bootstrapping, configuration, provisioning, scaling, upgrading, migration, disaster recovery, monitoring, and resource management. Rook uses the facilities provided by the underlying cloud-native container management, scheduling and orchestration platform to perform its duties.

https://github.com/rook/rook/blob/master/README.md

When I created the cluster I built VMs with 40GB hard drives, so with 5 Kubernetes nodes that gives me ~200GB of storage on my cluster, most of which I’ll use for Ceph.

Installing Rook+Ceph

Installing Rook+Ceph is pretty straightforward. On my personal cluster I installed Rook+Ceph v0.9.0 by following these steps:

git clone git@github.com:rook/rook.git
cd rook
git checkout v0.9.0
cd cluster/examples/kubernetes/ceph
kubectl create -f operator.yaml
kubectl create -f cluster.yaml

Rook deploys the PODs in two namespaces, rook-ceph-system and rook-ceph. On my cluster it took about 2 minutes for the PODs to deploy, initialize, and get to a running state. While I was waiting for everything to finish I checked the POD status with:

$ kubectl -n rook-ceph-system get pod
NAME                                  READY   STATUS    RESTARTS   AGE
rook-ceph-agent-8tsq7                 1/1     Running   0          2d20h
rook-ceph-agent-b6mgs                 1/1     Running   0          2d20h
rook-ceph-agent-nff8n                 1/1     Running   0          2d20h
rook-ceph-agent-vl4zf                 1/1     Running   0          2d20h
rook-ceph-agent-vtpbj                 1/1     Running   0          2d20h
rook-ceph-agent-xq5dv                 1/1     Running   0          2d20h
rook-ceph-operator-85d64cfb99-hrnbs   1/1     Running   0          2d20h
rook-discover-9nqrp                   1/1     Running   0          2d20h
rook-discover-b62ds                   1/1     Running   0          2d20h
rook-discover-k77gw                   1/1     Running   0          2d20h
rook-discover-kqknr                   1/1     Running   0          2d20h
rook-discover-v2hhb                   1/1     Running   0          2d20h
rook-discover-wbkkq                   1/1     Running   0          2d20h
$ kubectl -n rook-ceph get pod
NAME READY STATUS RESTARTS AGE
rook-ceph-mgr-a-7d884ddc8b-kfxt9 1/1 Running 0 2d20h
rook-ceph-mon-a-77cbd865b8-ncg67 1/1 Running 0 2d20h
rook-ceph-mon-b-7cd4b9774f-js8n9 1/1 Running 0 2d20h
rook-ceph-mon-c-86778859c7-x2qg9 1/1 Running 0 2d20h
rook-ceph-osd-0-67fff79666-fcrss 1/1 Running 0 35h
rook-ceph-osd-1-58bd4ccbbf-lsxj9 1/1 Running 1 2d20h
rook-ceph-osd-2-bf99864b5-n4q7v 1/1 Running 0 2d20h
rook-ceph-osd-3-577466c968-j8gjr 1/1 Running 0 2d20h
rook-ceph-osd-4-6856c5c6c9-92tb6 1/1 Running 0 2d20h
rook-ceph-osd-5-8669577f6b-zqrq9 1/1 Running 0 2d20h
rook-ceph-osd-prepare-node1-xfbs7 0/2 Completed 0 2d20h
rook-ceph-osd-prepare-node2-c9f55 0/2 Completed 0 2d20h
rook-ceph-osd-prepare-node3-5g4nc 0/2 Completed 0 2d20h
rook-ceph-osd-prepare-node4-wj475 0/2 Completed 0 2d20h
rook-ceph-osd-prepare-node5-tf5bt 0/2 Completed 0 2d20h

Final tasks

Now I need to do two more things before I can install Prometheus and Grafana:

  • I need to make Rook the default storage provider for my cluster.
  • Since the Prometheus Helm chart requests volumes formatted with the XFS filesystem, I need to install XFS tools on all of my Ubuntu Kubernetes nodes. (XFS is not yet installed by Kubespray by default, although there’s currently a PR up that addresses that issue.)

Make Rook the default storage provider

To make Rook the default storage provider I just run a kubectl command:

kubectl patch storageclass rook-ceph-block -p '{"metadata": {"annotations":{"storageclass.kubernetes.io/is-default-class":"true"}}}'

That updates the rook-ceph-block storage class and makes it the default for storage on the cluster. Any applications that I install will use Rook+Ceph for their data storage if they don’t specify a specific storage class.

Install XFS tools

Normally I would not recommend running one-off commands on a cluster. If you want to make a change to a cluster, you should encode the change in a playbook so it’s applied every time you update the cluster or add a new node. That’s why I submitted a PR to Kubespray to address this problem.

However, since my Kubespray PR has not yet merged, and I built the cluster using Kubespray, and Kubespray uses Ansible, one of the easiest ways to install XFS tools on all hosts is by using the Ansible “run a single command on all hosts” feature:

cd kubespray
export ANSIBLE_REMOTE_USER=ansible
ansible kube-node -i inventory/mycluster/hosts.ini \
--become --become-user root \
-a 'apt-get install -y xfsprogs'

Deploy Prometheus and Grafana

Now that XFS is installed I can successfully deploy Prometheus and Grafana using Helm:

helm install --name prometheus stable/prometheus
helm install --name grafana stable/grafana

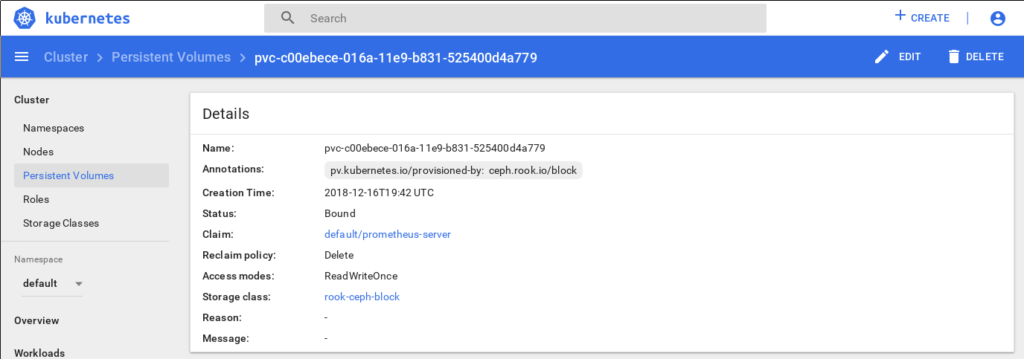
The Helm charts install Prometheus and Grafana and create persistent storage volumes on Rook+Ceph for Prometheus Server and Prometheus Alert Manager (formatted with XFS).

Prometheus dashboard

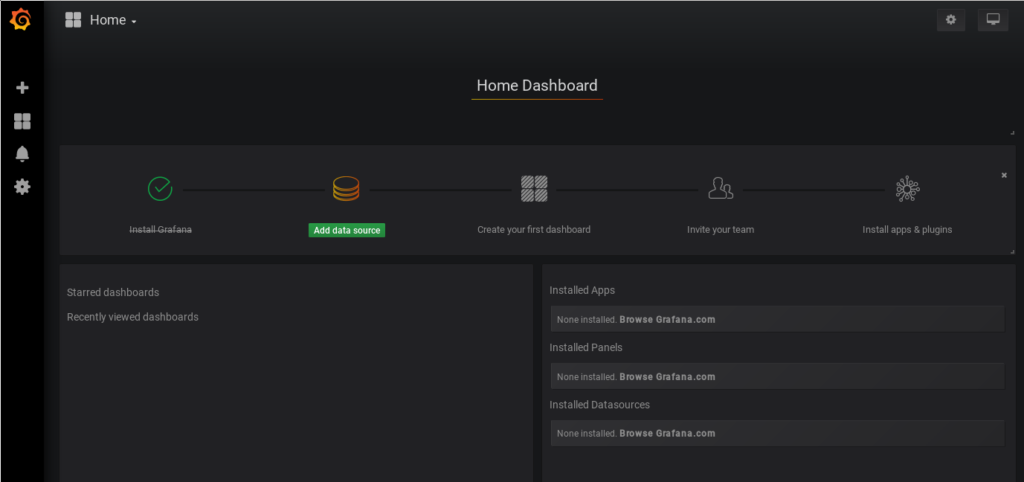
Grafana dashboard

Rook persistent volume for Prometheus Server

Want to learn more?

If you’re interested in learning more about Rook, watch these videos from KubeCon 2018:

Introduction to Rook

Rook Deep Dive

Hope you find this useful.

post

Setting up a personal, production-quality Kubernetes cluster with Kubespray

I’ve been setting up and tearing down Kubernetes clusters for testing various things for the past year, mostly using Vagrant/Virtualbox but also some VMware vSphere and OpenStack deployments.

I wanted to set something a little more permanent up at my home lab — a cluster where I could add and remove nodes, run nodes on multiple physical machines, and use different types of compute hardware.

Set up the virtual machines

To get started I used a desktop System76 Wild Dog Pro Linux box (4.5 GHz i7-7700K, 64GB DDR4) and my create-vm script to create six Ubuntu 18.04 “Bionic Beaver” VMs for the cluster:

for n in $(seq 1 6); do
create-vm -n node$n \
-i ./ubuntu-18.04-server-amd64.iso \
-k ./ubuntu.ks \
-r 4096 \
-c 2 \
-s 40
done

With these parameters each VM will have 4GB RAM, 2 VCPUs, and a 40GB hard drive.

Install and configure Kubespray

I cloned Kubespray into a directory and created an Ansible inventory file following the instructions from the README.

git clone git@github.com:kubernetes-sigs/kubespray.git
cd kubespray
pip install -r requirements.txt
rm -Rf inventory/mycluster/
cp -rfp inventory/sample inventory/mycluster
declare -a IPS=($(for n in $(seq 1 6); do get-vm-ip node$n; done))
CONFIG_FILE=inventory/mycluster/hosts.ini \
python3 contrib/inventory_builder/inventory.py ${IPS[@]}

The get-vm-ip script is in the same repo as the create-vm script, and both are described in my Use .iso and Kickstart files to automatically create Ubuntu VMs article.

The inventory.py script generates an Ansible hosts inventory file in inventory/mycluster/hosts.ini with all of your VM IP addresses.

I like to add one variable override to the bottom of hosts.ini which copies the kubectl credentials over to my host machine. That way I can run kubectl commands directly from my desktop. The extra lines to add to the bottom of hosts.ini are:

[all:vars]
kubectl_localhost=true

Install Kubernetes

To install Kubernetes on the VMs I run the Kubespray cluster.yaml playbook:

export ANSIBLE_REMOTE_USER=ansible
ansible-playbook -i inventory/mycluster/hosts.ini \
--become --become-user=root cluster.yml

Once the playbooks have finished, you should have a fully-operational Kubernetes cluster running on your desktop.

At this point you should be able to query the cluster from your desktop using kubectl. For example:

$ kubectl cluster-info
Kubernetes master is running at https://192.168.122.251:6443
coredns is running at https://192.168.122.251:6443/api/v1/namespaces/kube-system/services/coredns:dns/proxy
kubernetes-dashboard is running at https://192.168.122.251:6443/api/v1/namespaces/kube-system/services/https:kubernetes-dashboard:/proxy
To further debug and diagnose cluster problems, use 'kubectl cluster-info dump'.
$ kubectl get nodes
NAME STATUS ROLES AGE VERSION
node1 Ready master,node 3d6h v1.13.0
node2 Ready master,node 3d6h v1.13.0
node3 Ready node 3d6h v1.13.0
node4 Ready node 3d6h v1.13.0
node5 Ready node 3d6h v1.13.0
node6 Ready node 3d6h v1.13.0
$ kubectl get pods --all-namespaces
NAMESPACE NAME READY STATUS RESTARTS AGE
kube-system calico-kube-controllers-67f89845f-6zbvx 1/1 Running 1 3d6h
kube-system calico-node-jh7ng 1/1 Running 2 3d6h
kube-system calico-node-l9vfb 1/1 Running 2 3d6h
kube-system calico-node-mqxjx 1/1 Running 2 3d6h
...

Set up the Kubernetes Dashboard

One of the first things I like to do is set up access to the Kubernetes dashboard. First I set up a service account for the admin user:

$ cat ~/Projects/k8s-cluster/dashboard-adminuser.yaml
---
apiVersion: v1
kind: ServiceAccount
metadata:
name: admin-user
namespace: kube-system

---
apiVersion: rbac.authorization.k8s.io/v1
kind: ClusterRoleBinding
metadata:
name: admin-user
roleRef:
apiGroup: rbac.authorization.k8s.io
kind: ClusterRole
name: cluster-admin
subjects:
- kind: ServiceAccount
name: admin-user
namespace: kube-system
$ kubectl apply -f ~/Projects/k8s-cluster/dashboard-adminuser.yaml

Next I get the bearer token for the user account:

$ kubectl -n kube-system describe secret $(kubectl -n kube-system get secret | grep admin-user | awk '{print $1}')

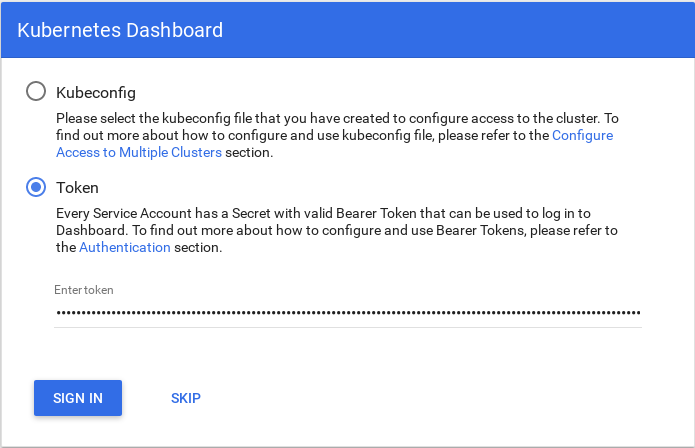
Finally I plug the dashboard URL that I got from kubectl cluster-info into my browser, select “Token” authentication, and cut and paste in the bearer token to log into the system.

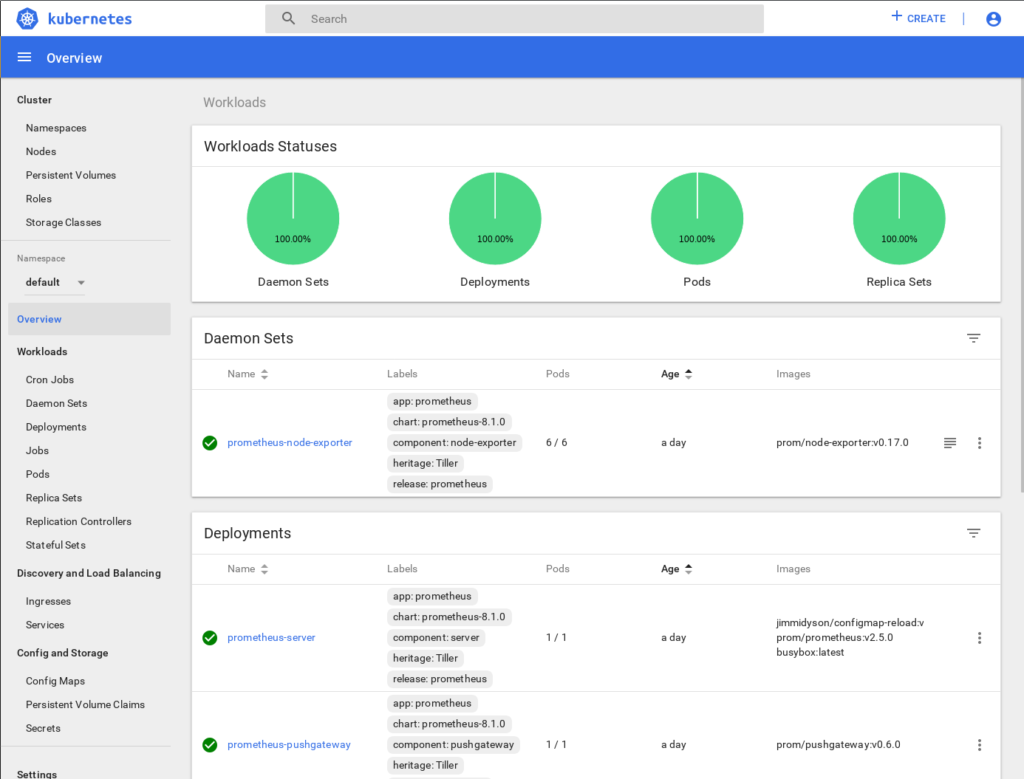
Once logged in, an overview of my cluster pops up:

With a minimal amount of working compute infrastructure, it’s easy to set up your own production-quality Kubernetes cluster using Kubespray.

Hope you find this useful.

Policy-based Cloud Storage

This is a talk I gave last week at the SF Microservices Meetup titled Policy-based Cloud Storage, Persisting Data in a Multi-Site, Multi-Cloud World. In it I cover Apcera‘s approach to storage for containers and how to use policy to manage very large scale application deployments.