The Ansible user: command allows you to add a user to a Linux system with a password. The password must be passed to Ansible in a hashed password format using one of the hash formats supported by /etc/shadow.
Some Ansible docs suggest storing your passwords in plain text and using the Ansible SHA512 filter to hash the plaintext passwords before passing them to the user module. This is a bad practice for a number of reasons.
Storing your passwords in plain text is a bad idea
The play is not idempotent, since the SHA512 filter will re-hash the password every time you run the play, resetting the password each time the play is run.
Attempting to make the play idempotent, by using update_password: on_create, means that you can no longer update the password using Ansible. This might be OK if you’re just updating one machine. It’s a giant pain in the ass if you need to update the password on many machines.
A better way is to hash the password once using openssl and store the hashed version of the password in your Ansible playbooks:
- name: Set the user's password
  user:
    name: earl
    password: "$6$wLZ77bHhLVJsHaMz$WqJhNW2VefjhnupK0FBj5LDPaONaAMRoiaWle4rU5DkXz7hxhl3Gxcwshuy.KQWRFt6YPWXNbdKq9B/Rk9q7A."
To generate the hashed password use the openssl passwd command on any Linux host:
openssl passwd -6 -stdin
This opens an interactive shell to openssl. Just enter the password that you want to use, hit enter, and openssl will respond with the hashed version. Copy and paste the hashed version of the password into Ansible, and the next time you run Ansible on a host the user’s password will be updated.
Type Ctrl-D to exit the interactive openssl shell.
Since you used the interactive shell the plaintext password that you entered is not saved into the Linux host’s history file and is not visible to anyone running ps.
The crypted password is encrypted with a SHA512 one-way hash and a random 16 character salt, so you can check the playbook into a Git repository without revealing your password.
For a long time rebooting a host with Ansible has been tricky. The steps are:
ssh to the host
Reboot the host
Disconnect before the host closes your ssh connection
Wait some number of seconds to ensure the host has really shut down
Attempt to ssh to the host and execute a command
Repeat ssh attempt until it works or you give up
Seems clear enough, but if you Google for an answer you may end up at this StackExchange page that gives lots of not-quite-correct answers from 2015 (and one correct answer). Some people suggest checking port 22, but just because ssh is listening doesn’t mean that it’s at state where it’s accepting connections.
The correct answer is use Ansible version 2.7 or greater. 2.7 introduced the reboot command, and now all you have to do is add this to your list of handlers:
- name: Reboot host and wait for it to restart
  reboot:
    msg: "Reboot initiated by Ansible"
    connect_timeout: 5
    reboot_timeout: 600
    pre_reboot_delay: 0
    post_reboot_delay: 30
    test_command: whoami
This handler will:
Reboot the host
Wait 30 seconds
Attempt to connect via ssh and run whoami
Disconnect after 5 seconds if it ssh isn’t working
Keep attempting to connect for 10 minutes (600 seconds)
Add the directive:
notify: Reboot host and wait for it to restart
… to any Ansible command that requires a reboot after a change. The host will be rebooted when the playbook finishes, then Ansible will wait until the host is back up and ssh is working before continuing on to the next playbook.
If you need to reboot halfway through a playbook you can force all handlers to execute with the command:
- name: Reboot if necessary
  meta: flush_handlers
I sometimes do that to change something, force a reboot, then verify that the change worked, all within the same playbook.
I wanted to install Prometheus and Grafana on my new Kubernetes cluster, but in order for these packages to work they need someplace to store persistent data. I had run performance and scale tests on Ceph when I was working as a Cloud Architect at Seagate, and I’ve played with Rook during the past year, so I decided to install Rook+Ceph and use that for the Kubernetes cluster’s data storage.
Ceph is a distributed storage system that provides object, file, and block storage. On each storage node you’ll find a file system where Ceph stores objects and a Ceph OSD (Object storage daemon) process. On a Ceph cluster you’ll also find Ceph MON (monitoring) daemons, which ensure that the Ceph cluster remains highly available.
Rook acts as a Kubernetes orchestration layer for Ceph, deploying the OSD and MON processes as POD replica sets. From the Rook README file:
Rook turns storage software into self-managing, self-scaling, and self-healing storage services. It does this by automating deployment, bootstrapping, configuration, provisioning, scaling, upgrading, migration, disaster recovery, monitoring, and resource management. Rook uses the facilities provided by the underlying cloud-native container management, scheduling and orchestration platform to perform its duties.
When I created the cluster I built VMs with 40GB hard drives, so with 5 Kubernetes nodes that gives me ~200GB of storage on my cluster, most of which I’ll use for Ceph.
Installing Rook+Ceph
Installing Rook+Ceph is pretty straightforward. On my personal cluster I installed Rook+Ceph v0.9.0 by following these steps:
git clone git@github.com:rook/rook.git
cd rook
git checkout v0.9.0
cd cluster/examples/kubernetes/ceph
kubectl create -f operator.yaml
kubectl create -f cluster.yaml
Rook deploys the PODs in two namespaces, rook-ceph-system and rook-ceph. On my cluster it took about 2 minutes for the PODs to deploy, initialize, and get to a running state. While I was waiting for everything to finish I checked the POD status with:
Now I need to do two more things before I can install Prometheus and Grafana:
I need to make Rook the default storage provider for my cluster.
Since the Prometheus Helm chart requests volumes formatted with the XFS filesystem, I need to install XFS tools on all of my Ubuntu Kubernetes nodes. (XFS is not yet installed by Kubespray by default, although there’s currently a PR up that addresses that issue.)
Make Rook the default storage provider
To make Rook the default storage provider I just run a kubectl command:
That updates the rook-ceph-block storage class and makes it the default for storage on the cluster. Any applications that I install will use Rook+Ceph for their data storage if they don’t specify a specific storage class.
Install XFS tools
Normally I would not recommend running one-off commands on a cluster. If you want to make a change to a cluster, you should encode the change in a playbook so it’s applied every time you update the cluster or add a new node. That’s why I submitted a PR to Kubespray to address this problem.
However, since my Kubespray PR has not yet merged, and I built the cluster using Kubespray, and Kubespray uses Ansible, one of the easiest ways to install XFS tools on all hosts is by using the Ansible “run a single command on all hosts” feature:
cd kubespray
export ANSIBLE_REMOTE_USER=ansible
ansible kube-node -i inventory/mycluster/hosts.ini \
  --become --become-user root \
  -a 'apt-get install -y xfsprogs'
Deploy Prometheus and Grafana
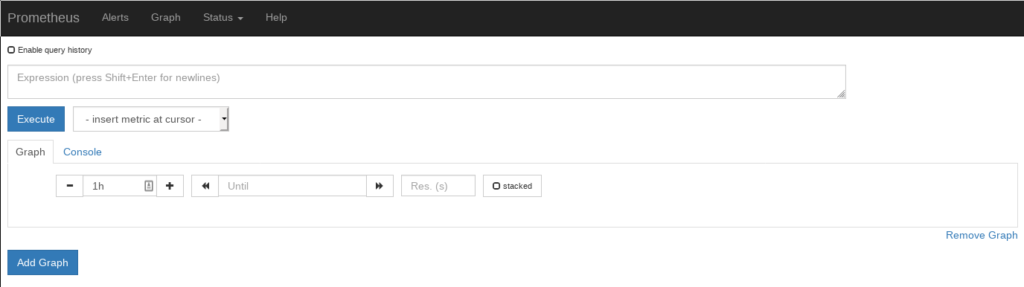
Now that XFS is installed I can successfully deploy Prometheus and Grafana using Helm:
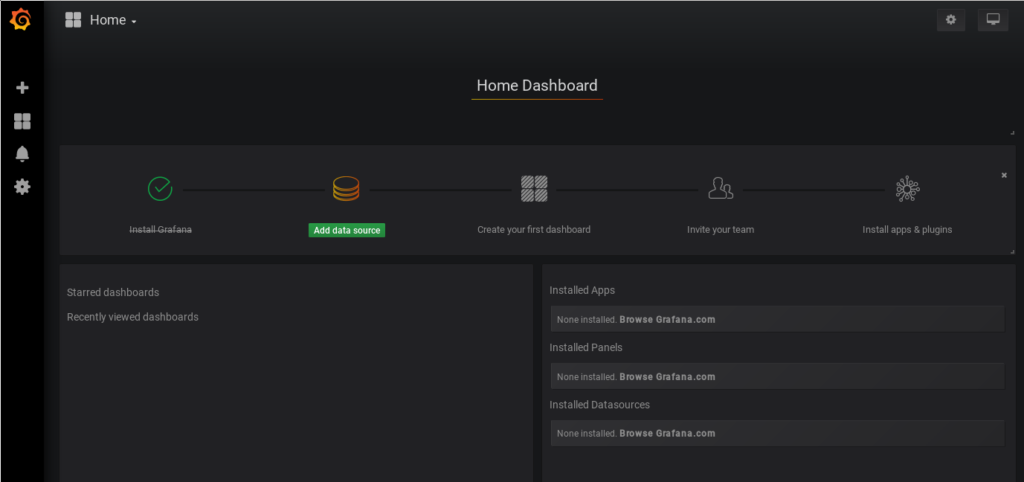
The Helm charts install Prometheus and Grafana and create persistent storage volumes on Rook+Ceph for Prometheus Server and Prometheus Alert Manager (formatted with XFS).
Prometheus dashboard
Grafana dashboard
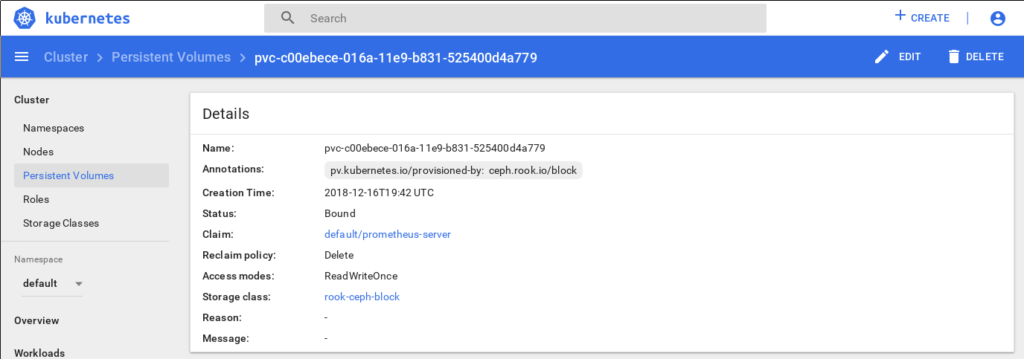
Rook persistent volume for Prometheus Server
Want to learn more?
If you’re interested in learning more about Rook, watch these videos from KubeCon 2018:
I’ve been setting up and tearing down Kubernetes clusters for testing various things for the past year, mostly using Vagrant/Virtualbox but also some VMware vSphere and OpenStack deployments.
I wanted to set something a little more permanent up at my home lab — a cluster where I could add and remove nodes, run nodes on multiple physical machines, and use different types of compute hardware.
Set up the virtual machines
To get started I used a desktop System76 Wild Dog Pro Linux box (4.5 GHz i7-7700K, 64GB DDR4) and my create-vm script to create six Ubuntu 18.04 “Bionic Beaver” VMs for the cluster:
for n in $(seq 1 6); do
    create-vm -n node$n \
      -i ./ubuntu-18.04-server-amd64.iso \
      -k ./ubuntu.ks \
      -r 4096 \
      -c 2 \
      -s 40
done
With these parameters each VM will have 4GB RAM, 2 VCPUs, and a 40GB hard drive.
Install and configure Kubespray
I cloned Kubespray into a directory and created an Ansible inventory file following the instructions from the README.
git clone git@github.com:kubernetes-sigs/kubespray.git
cd kubespray
pip install -r requirements.txt
rm -Rf inventory/mycluster/
cp -rfp inventory/sample inventory/mycluster
declare -a IPS=($(for n in $(seq 1 6); do get-vm-ip node$n; done))
CONFIG_FILE=inventory/mycluster/hosts.ini \
  python3 contrib/inventory_builder/inventory.py ${IPS[@]}
The inventory.py script generates an Ansible hosts inventory file in inventory/mycluster/hosts.ini with all of your VM IP addresses.
I like to add one variable override to the bottom of hosts.ini which copies the kubectl credentials over to my host machine. That way I can run kubectl commands directly from my desktop. The extra lines to add to the bottom of hosts.ini are:
[all:vars]
kubectl_localhost=true
Install Kubernetes
To install Kubernetes on the VMs I run the Kubespray cluster.yaml playbook:
Once the playbooks have finished, you should have a fully-operational Kubernetes cluster running on your desktop.
At this point you should be able to query the cluster from your desktop using kubectl. For example:
$ kubectl cluster-info
Kubernetes master is running at https://192.168.122.251:6443
coredns is running at https://192.168.122.251:6443/api/v1/namespaces/kube-system/services/coredns:dns/proxy
kubernetes-dashboard is running at https://192.168.122.251:6443/api/v1/namespaces/kube-system/services/https:kubernetes-dashboard:/proxy
To further debug and diagnose cluster problems, use 'kubectl cluster-info dump'.
$ kubectl get nodes
NAME    STATUS   ROLES         AGE    VERSION
node1   Ready    master,node   3d6h   v1.13.0
node2   Ready    master,node   3d6h   v1.13.0
node3   Ready    node          3d6h   v1.13.0
node4   Ready    node          3d6h   v1.13.0
node5   Ready    node          3d6h   v1.13.0
node6   Ready    node          3d6h   v1.13.0
$ kubectl get pods --all-namespaces
NAMESPACE          NAME                                           READY   STATUS      RESTARTS   AGE
kube-system        calico-kube-controllers-67f89845f-6zbvx        1/1     Running     1          3d6h
kube-system        calico-node-jh7ng                              1/1     Running     2          3d6h
kube-system        calico-node-l9vfb                              1/1     Running     2          3d6h
kube-system        calico-node-mqxjx                              1/1     Running     2          3d6h
...
Set up the Kubernetes Dashboard
One of the first things I like to do is set up access to the Kubernetes dashboard. First I set up a service account for the admin user:
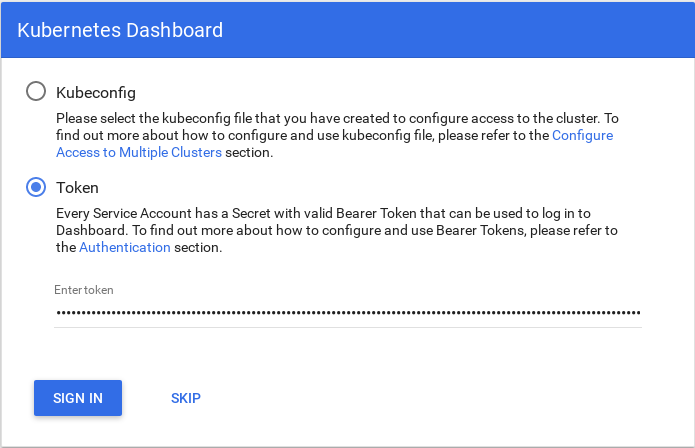
Finally I plug the dashboard URL that I got from kubectl cluster-info into my browser, select “Token” authentication, and cut and paste in the bearer token to log into the system.
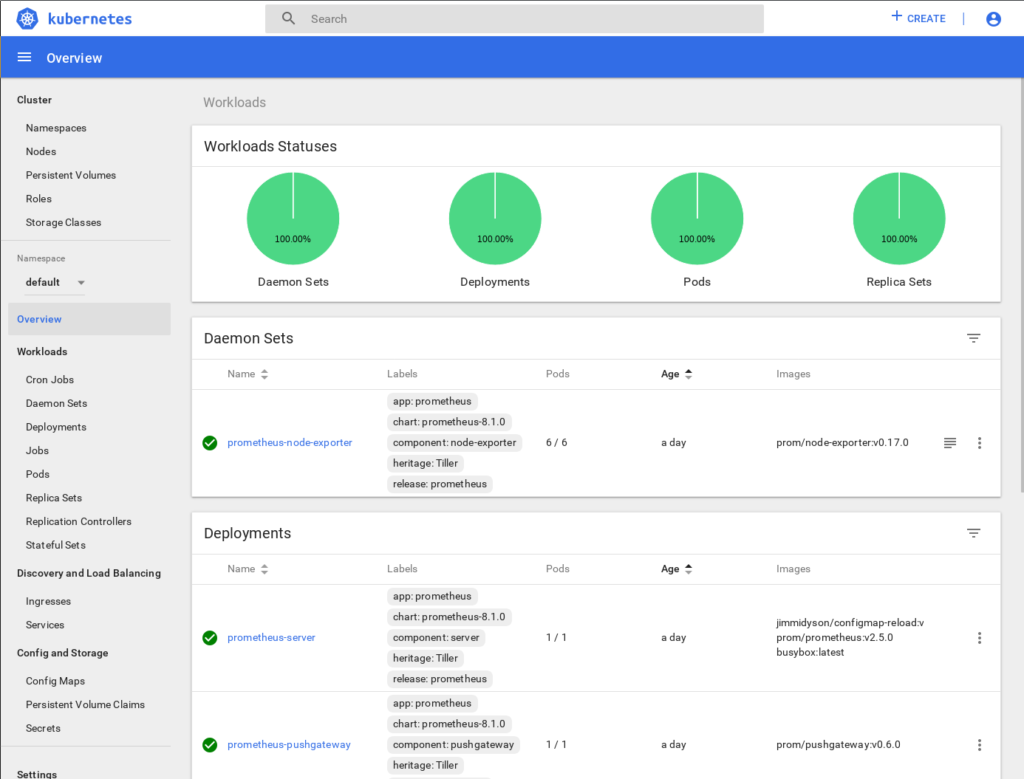
Once logged in, an overview of my cluster pops up:
With a minimal amount of working compute infrastructure, it’s easy to set up your own production-quality Kubernetes cluster using Kubespray.
I needed to add some sudo access rights for support personnel on about a hundred Centos 6.6 servers. Currently no one one these hosts had sudo rights, so the /etc/sudoers file was the default file. I’m using Ansible to maintain these hosts, but rather than modify the default /etc/sudoers file using Ansible’s lineinfile: command, I decided to create a support.conf file and use Ansible’s copy: command to copy that file into /etc/sudoers.d/. That way if a future version of Centos changes the /etc/sudoers file I’m leaving that file untouched, so my changes should always work.
The support.conf file I created copied over just fine, and the validation step of running “visudo -cf” on the file before moving it into place claimed that the file was error-free and should work just fine as a sudoers file.
I logged in as the support user and it didn’t work:
[support@c1n1 ~]$ sudo /bin/ls /var/log/*
support is not in the sudoers file.  This incident will be reported.
Not only did it not work, it was telling me that the support user wasn’t even in the file, which they clearly were.
After Googling around a bit and not finding much I saw this in the Sudoers Manual:
sudo will read each file in /etc/sudoers.d, skipping file names that end in ‘~’ or contain a ‘.’ character to avoid causing problems with package manager or editor temporary/backup files.
sudo was skipping the file because the file name contained a period!
I changed the name of the file from support.conf to support and it worked.
We use technologies like cookies to store and/or access device information. We do this to improve browsing experience and to show (non-) personalized ads. Consenting to these technologies will allow us to process data such as browsing behavior or unique IDs on this site. Not consenting or withdrawing consent, may adversely affect certain features and functions.
Functional
Always active
The technical storage or access is strictly necessary for the legitimate purpose of enabling the use of a specific service explicitly requested by the subscriber or user, or for the sole purpose of carrying out the transmission of a communication over an electronic communications network.
Preferences
The technical storage or access is necessary for the legitimate purpose of storing preferences that are not requested by the subscriber or user.
Statistics
The technical storage or access that is used exclusively for statistical purposes.The technical storage or access that is used exclusively for anonymous statistical purposes. Without a subpoena, voluntary compliance on the part of your Internet Service Provider, or additional records from a third party, information stored or retrieved for this purpose alone cannot usually be used to identify you.
Marketing
The technical storage or access is required to create user profiles to send advertising, or to track the user on a website or across several websites for similar marketing purposes.